Seamlessly connect SparkMap data to your database. Ideal for organizations and individuals with programming experience, the SparkMap API provides direct access to over 350 indicators without having to download or import files.


Seamlessly connect SparkMap data to your database. Ideal for organizations and individuals with programming experience, the SparkMap API provides direct access to over 350 indicators without having to download or import files.
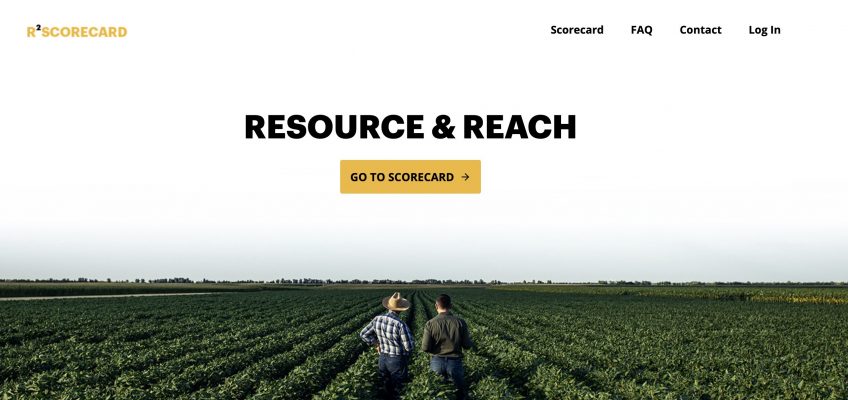
The RSquared scorecard provides MU Extension faculty with quantifiable metrics about their programs. The scorecard has two sections – Resources and Reach (R2) – and pulls in data from the MU Extension PEARS reporting system alongside metrics related to media reach and revenue generation.
In partnership with the Johns Hopkins Bloomberg School of Public Health, CARES is working with the Ardmore Institute for Health to examine the impact of Blue Zones and Wellville initiatives on communities across the United States. Using longitudinal data to assess health interventions and outcomes, the final report will provide insight into the efficacy of certain health interventions and strategies.
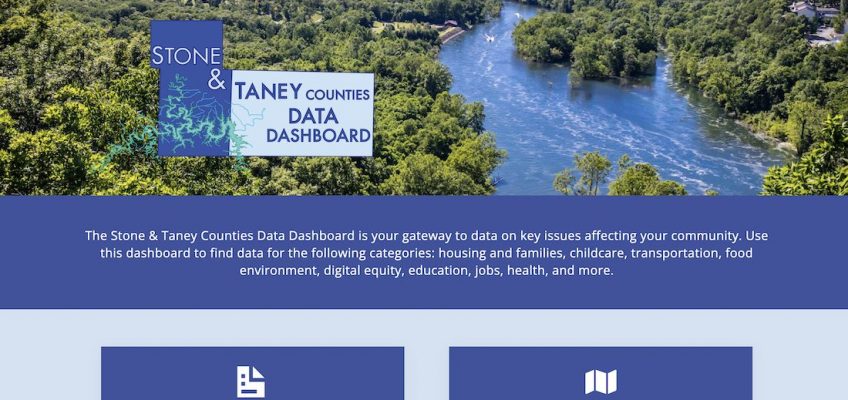
The Stone & Taney Counties Data Dashboard is a regional gateway to data on key issues affecting local communities. Local organizations use the dashboard to find data for the following categories: housing and families, childcare, transportation, food environment, digital equity, education, jobs, and health.
CARES launched SparkMap in 2019. SparkMap hosts a robust Community Needs Assessment tool, data upload tools, ZIP code level reports, and more. SparkMap is a great subscription service for healthcare consultants, grant writers, community benefit managers, and others working on community needs assessments.
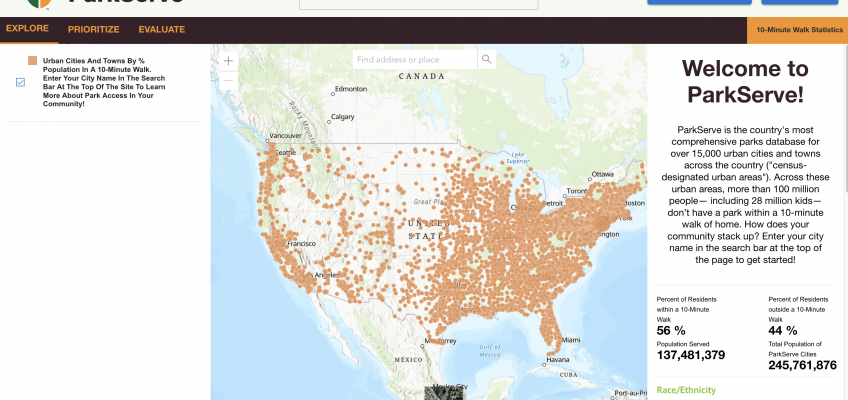
CARES provided data analysis and programming support for the ParkScore and ParkServe projects created by the Trust for Public Land. ParkServe is the country’s most comprehensive parks database for over 15,000 urban cities and towns across the country. The ParkScore® index is the national gold-standard comparison of park systems across the 100 most populous cities in the United States.
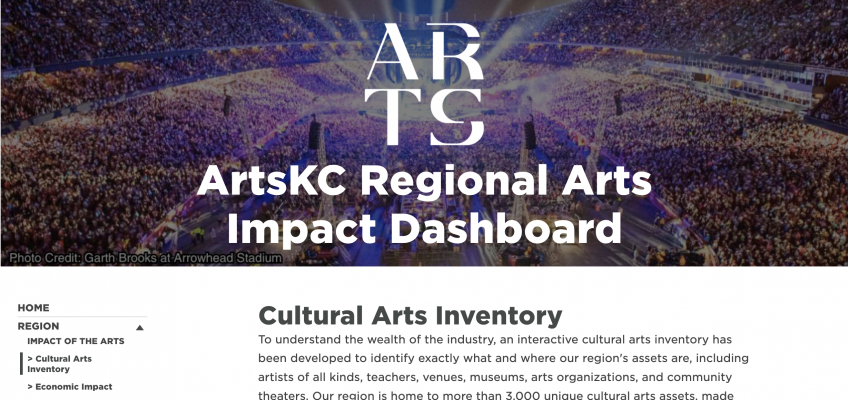
In 2023, CARES assisted ArtsKC with an asset mapping project. CARES provided data validation and data cleaning services to support the development of an arts-focused community dashboard. The dashboard can be viewed here.

CARES, in partnership with Colorado State University, engaged in a series of listening and design sessions with stakeholders from across CSU Extension to learn more about their data needs and potential solutions. CARES summarized and synthesized findings from the sessions and delivered recommendations and a roadmap to CSU OEE for review and planning.
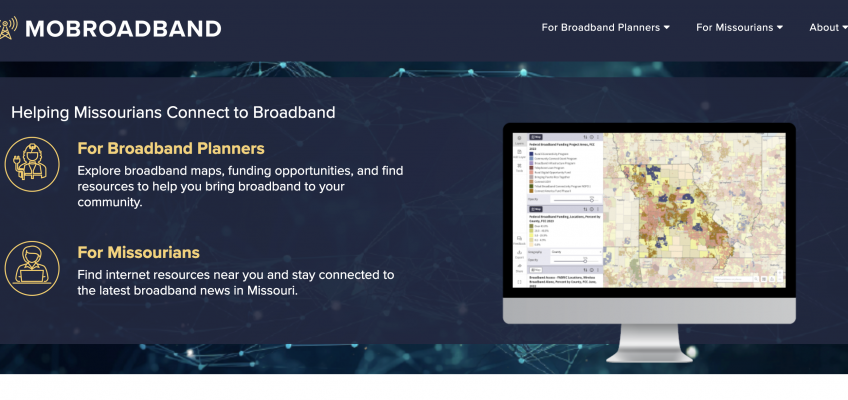
CARES maintained and curated mobroadband.org (formerly known as the Missouri Broadband Resource Rail) and supported broadband research and projects through data collection, analysis, and mapping from 2017 to 2026. CARES supported a robust Broadband Needs Assessment, broadband-focused map galleries, the Missouri Digital Asset Map, and the underlying technology for the site. MoBroadband is a project of the Office of Engagement and Extension at the University of Missouri and is governed by the UM Broadband Steering Committee.

CARES provided data to the healthcare strategy team at Guidehouse for analysis and use in a health needs assessment.